I'm asking this mostly to help my own design work in the future. I have a basic grasp of probability, with some holes.
The questions are as follows:
1) What is the formula for computing permutations and combinations?
2) How do you determine the statistical shift in the mean when differentiating between 3d6, 4d6 choose 3 highest and 4d6 choose 3 lowest?
3) How do you determine the statistical shift in the mean when differentiating between 3d6, 3d6 reroll 1s and 3d6 reroll 6s?
4) On a d20 RNG, how much 'space' is there? Essentially, how much can it be shifted by before it becomes a serious concern for balance/people falling off it? What about a 3d6 RNG?
Sorry if some of these sound a bit daft, I'm not much of a maths person.
Some questions on statistics
Moderator: Moderators
Some questions on statistics
Everything I learned about DnD, I learned from Frank Trollman.
Kaelik wrote:You are so full of Strawmen that I can only assume you actually shit actual straw.
souran wrote:...uber, nerd-rage-inducing, minutia-devoted, pointless blithering shit.
Schwarzkopf wrote:The Den, your one-stop shop for in-depth analysis of Dungeons & Dragons and distressingly credible threats of oral rape.
DSM wrote:Apparently, The GM's Going To Punch You in Your Goddamned Face edition of D&D is getting more traction than I expected. Well, it beats playing 4th. Probably 5th, too.
Frank Trollman wrote:Giving someone a mouth full of cock is a standard action.
PoliteNewb wrote:If size means anything, it's what position you have to get in to give a BJ.
1. Permutations (without repeats).
We have an assortment of n different items (A B C D E F G H) and have to select a sequence of k of these items (where k<=n, obviously).
So we choose the first item for our sequence. As we currently have n items available, there are n possible variants.
Then we choose an item for position 2, and there are n-1 possible variants (because one is already unavailable, having been removed from the assortment and placed into position 1).
So there are n*(n-1) different variants to fill those two positions,
n*(n-1)*(n-2) variants for a sequence of 3 positions, and n*(n-1)*(n-2)*...*(n-(k-1)) variants (or permutations) for a sequence of length k (8*7*6*5*4=6720 in our example).
To shorten the formula, the ! sign (factorial) is used, where n! = 1*2*3*...*n (also, 0! = 1).
or, in our example,
We have an assortment of n different items (A B C D E F G H) and have to select a sequence of k of these items (where k<=n, obviously).
Code: Select all
n=8, k=5
A B C D E F G H -- 8 items to choose from

1 2 3 4 5
. . . . . -- the sequence, currently empty
Code: Select all
n=8, k=5
A B . D E F G H -- 7 items left to choose from

1 2 3 4 5
C . . . . -- one of 8 possible variants
Code: Select all
n=8, k=5
A B . D E F G . -- 6 items left to choose from

1 2 3 4 5
C H . . . -- one of 8*7 = 56 possible variants
Code: Select all
n=8, k=5
A B . . E F G . -- 5 items to choose from

1 2 3 4 5
C H D . . -- one of 8*7*6 = 336 possible variants
To shorten the formula, the ! sign (factorial) is used, where n! = 1*2*3*...*n (also, 0! = 1).
Code: Select all
                                          n*(n-1)*(n-2)*...*3*2*1        n!
P(n, k) = n*(n-1)*(n-2)*...*(n-(k-1)) = --------------------------- = --------
                                         (n-k)*(n-(k+1))*...*3*2*1     (n-k)!
Code: Select all
                       8*7*6*5*4*3*2*1     8!       8!
P(8, 5) = 8*7*6*5*4 = ----------------- = ---- = --------
                            3*2*1          3!     (8-5)!
Last edited by Starmaker on Thu Apr 02, 2009 8:51 pm, edited 1 time in total.
-
DragonChild
- Knight-Baron
- Posts: 583
- Joined: Sun Mar 09, 2008 7:39 am
This one is easy.3) How do you determine the statistical shift in the mean when differentiating between 3d6, 3d6 reroll 1s and 3d6 reroll 6s?
The statistical mean for 3d6 is simply found by finding the mean of 1d6, and multiplying by 3. To find the mean for 1d6, we... well, we take the mean. For example:
1d6 mean = (1+2+3+4+5+6)/6 = 3.5
Now, to find the mean for 1d6, reroll 1s, we remove the 1. Now, there are only 5 possibilities, all equally likely.
1d6, reroll 1 mean = (2+3+4+5+6)/5 = 4.0
Reroll 6s are the same way.
1d6, reroll 6 mean = (1+2+3+4+5)/5 = 3.0
So the mean of 3d6 is 10.5 for a normal roll, 12.0 for a reroll 1 roll, and 9.0 for rerolling 6s.
When in doubt for statistical questions, if you're dealing with a very small permutation size, write out every possibility and just find the odds of each. It's not "clean" and only works for really small problems like this one, but it's a good method to help see WHY you get the answer you do.
For a d20, assuming it's 1d20 vs set DC, each +1 gives you a +5% chance of success. This never changes - how much a % difference between people is pretty much whatever you're comfortable with.4) On a d20 RNG, how much 'space' is there? Essentially, how much can it be shifted by before it becomes a serious concern for balance/people falling off it? What about a 3d6 RNG?
For a 3d6, it gets more complicated. Each +1 or -1 gives you a different change in chance of success than the last. I have the data written up somewhere here... if I can find it, I'll post it. If not, I'll draw up a graph for you come monday, as it's been something I've been wanting to look at recently as well.
Last edited by DragonChild on Thu Apr 02, 2009 8:55 pm, edited 3 times in total.
First of all, thanks guys - the explanations helped a lot.
I'm not sure you quite got what I meant, which is OK. Basically, I meant that 1s only get rerolled once - if you get another 1 on the re-roll, that one sticks. Does this complicate the picture, or am I seeing things I'm not supposed to.DragonChild wrote:
Now, to find the mean for 1d6, reroll 1s, we remove the 1. Now, there are only 5 possibilities, all equally likely.
1d6, reroll 1 mean = (2+3+4+5+6)/5 = 4.0
Reroll 6s are the same way.
1d6, reroll 6 mean = (1+2+3+4+5)/5 = 3.0
Everything I learned about DnD, I learned from Frank Trollman.
Kaelik wrote:You are so full of Strawmen that I can only assume you actually shit actual straw.
souran wrote:...uber, nerd-rage-inducing, minutia-devoted, pointless blithering shit.
Schwarzkopf wrote:The Den, your one-stop shop for in-depth analysis of Dungeons & Dragons and distressingly credible threats of oral rape.
DSM wrote:Apparently, The GM's Going To Punch You in Your Goddamned Face edition of D&D is getting more traction than I expected. Well, it beats playing 4th. Probably 5th, too.
Frank Trollman wrote:Giving someone a mouth full of cock is a standard action.
PoliteNewb wrote:If size means anything, it's what position you have to get in to give a BJ.
-
Heath Robinson
- Knight
- Posts: 393
- Joined: Sun Aug 17, 2008 9:26 am
- Location: Blighty
Combinations
3.
A D6 where you reroll a 1 is a D5 + 1. A D6 where you reroll a 6 is a D5. You find the average of these rolls by multiplying the average of a single dice by the number of dice you're rolling. You find the average of one dice by summing the product of a faces value by the chance of it being rolled. I'll come back to this when I get around to handling number 2.
Because a D6 produces a uniform distribution this equates to just summing the values of the sides and dividing by the number of sides. That's equal to adding the highest and lowest values and dividing by two. The average of a D5 roll is 3. For a D6 roll it's 3+1/2. 3D5 has a mean of 9. 3D5+3 = 12. 3D6 = 10+1/2.
If you want mathematical proof that a D6 with rerolled 1s is a D5, then you just need to calculate the limit the sum of an infinite series progresses towards when your initial value is 1/6 and the ratio is 1/6.
2.
Tackling this problem is significantly more complex. Using maximum and minimum functions in maths is really inelegant. I'd suggest brute forcing it via a script, since you only need to calculate it once. May I suggest my favourite scripting language, Lua?
As a slight optimisation, you can select only the values that you add (aka significant values) and then simply calculate the probability that the missing die doesn't contradict your selection. You multiply this by the probability of three dice rolling the significant values.
ie, for drop lowest
You still have to sum over all the combinations of the three significant dice. You can't even use the binomial distribution shortcut because the probability of the remaining dice not contradicting the 3 significant results is related to the highest or lowest value.
See the italicised part of my number 3 section for what you need to do when you calculate the mean result of a dice roll. Another optimisation is that the chances of rolling 3 particular numbers when you have a uniform distribution will always be the same, so you can save yourself reclaculating that every time.
Code: Select all
C( n, r) = P( n, r) / r!
= n! / (r!(n-r)!)
A D6 where you reroll a 1 is a D5 + 1. A D6 where you reroll a 6 is a D5. You find the average of these rolls by multiplying the average of a single dice by the number of dice you're rolling. You find the average of one dice by summing the product of a faces value by the chance of it being rolled. I'll come back to this when I get around to handling number 2.
Because a D6 produces a uniform distribution this equates to just summing the values of the sides and dividing by the number of sides. That's equal to adding the highest and lowest values and dividing by two. The average of a D5 roll is 3. For a D6 roll it's 3+1/2. 3D5 has a mean of 9. 3D5+3 = 12. 3D6 = 10+1/2.
If you want mathematical proof that a D6 with rerolled 1s is a D5, then you just need to calculate the limit the sum of an infinite series progresses towards when your initial value is 1/6 and the ratio is 1/6.
Code: Select all
a / (1 - r) = (1/6) / (1 - (1/6))
= (1/6) / (5/6)
= (1/6) * (6/5)
= (1 * 6) / (6 * 5)
= 1/5
2.
Tackling this problem is significantly more complex. Using maximum and minimum functions in maths is really inelegant. I'd suggest brute forcing it via a script, since you only need to calculate it once. May I suggest my favourite scripting language, Lua?
As a slight optimisation, you can select only the values that you add (aka significant values) and then simply calculate the probability that the missing die doesn't contradict your selection. You multiply this by the probability of three dice rolling the significant values.
ie, for drop lowest
Code: Select all
Assume that the 3 significant results are 2, 3, 4 = 9
The probability of these results is 1/(6^3) = 1/216

The remaining die wouldn't contradict this selection of significant results if it rolled a 1 or 2.  Hence, the probability of the remaining die not contradicting this = 2/6 = 1/3

The bit where this gets annoying is that you have the results 2, 3, 4, x.  You need to calculate how many different orders you can put these in.  That number of 4! = 4 * 3 * 2 * 1 = 24

Multiply them all to get 24 * (1/216) * (1/3) = 8/216
= 4/108
= 2/54
= 1/29
See the italicised part of my number 3 section for what you need to do when you calculate the mean result of a dice roll. Another optimisation is that the chances of rolling 3 particular numbers when you have a uniform distribution will always be the same, so you can save yourself reclaculating that every time.
Last edited by Heath Robinson on Thu Apr 02, 2009 9:30 pm, edited 6 times in total.
Face it. Today will be as bad a day as any other.
The devil is often in the details. Whether you're sampling with or without replacement, whether order matters, the number of times a procedure is repeated before you "give up," etc. can all substantially impact calculations.
For example "3d6 reroll 1s" has a different outcome based on whether you keep rerolling until you get something other than 1s, or you keep the 1s if you roll them on the reroll. In the latter case, there's a 1/36 chance of a given die finally being a 1, and a 7/36 chance of each other outcome (that's a 1/6 chance of getting it on the first roll, plus a 1/6 chance of making a second roll times a 1/6 chance of getting it on the second roll if you make one).
I second the suggestion of using computer programs for hard calculations. If you're lazy and only need approximate results, you can somtimes use a random number generator and just perform the roll 10,000 times and count up the results, rather than calculating exact theoretical distributions. I made a very complicated Excel spreadsheet for computing average combat results in Descent: Journeys in the Dark, but for a more specific problem you can get away with something much simpler.
Last edited by Manxome on Thu Apr 02, 2009 9:18 pm, edited 1 time in total.
2. Combinations without repeats.
We have an assortment of n different items (A B C D E F G H) and have to select a set of k of these items. The order in which we select items is now irrelevant.
A mental experiment (as in Permutations) generates a sequence of elements, where A B C D E, C D B A E and D C E A B are different permutations but the same combination. So how many different permutations of items A B C D E exist that are actually the same combination?
P (5, 5) = 5!/(5-5)! = 5! = 120
and, in general,
P (k, k) = k!
In fact, any given combination, when we think of it as the initial set, gives us k! permutations.
To rephrase: there are C(n, k) combinations, each of them produces k! permutations, and the total number of these permutations is P(n, k).
In our example, C(8, 5) = 8!/(3!*5!) = 120.
We have an assortment of n different items (A B C D E F G H) and have to select a set of k of these items. The order in which we select items is now irrelevant.
A mental experiment (as in Permutations) generates a sequence of elements, where A B C D E, C D B A E and D C E A B are different permutations but the same combination. So how many different permutations of items A B C D E exist that are actually the same combination?
P (5, 5) = 5!/(5-5)! = 5! = 120
and, in general,
P (k, k) = k!
In fact, any given combination, when we think of it as the initial set, gives us k! permutations.
To rephrase: there are C(n, k) combinations, each of them produces k! permutations, and the total number of these permutations is P(n, k).
Code: Select all
C(n, k) = k! * P(n, k)

           P(n, k)         n!
C(n, k) = --------- = -------------
              k!       (n-k)! * k!
Last edited by Starmaker on Thu Apr 02, 2009 9:24 pm, edited 1 time in total.
-
DragonChild
- Knight-Baron
- Posts: 583
- Joined: Sun Mar 09, 2008 7:39 am
Yup. My bad. What Manxome said here is true:I'm not sure you quite got what I meant, which is OK. Basically, I meant that 1s only get rerolled once - if you get another 1 on the re-roll, that one sticks. Does this complicate the picture, or am I seeing things I'm not supposed to.
This is a good way of describing it. Formula wise, it's looking like:For example "3d6 reroll 1s" has a different outcome based on whether you keep rerolling until you get something other than 1s, or you keep the 1s if you roll them on the reroll. In the latter case, there's a 1/36 chance of a given die finally being a 1, and a 7/36 chance of each other outcome (that's a 1/6 chance of getting it on the first roll, plus a 1/6 chance of making a second roll times a 1/6 chance of getting it on the second roll if you make one).
[7*(2+3+4+5+6) + 1 ] / 36 = 3.92.
Not much of a difference, overall. Only a 0.08 change in the average roll.
Before reading Manxome's solution, I worked out in my head this method of solving it.
When you roll the die, your average is: (X+2+3+4+5+6)/6.
Where "X" is rolling another d6. Or, in other words, 3.5. Plugging 3.5 into the formula gives you a result of 3.92.
This is basically doing it in "steps".
Last edited by DragonChild on Thu Apr 02, 2009 9:47 pm, edited 2 times in total.
In fact, we can define an "elementary permutation" as a sequence of n items chosen from a set of n different items (which means there are E(n) = n! possible EPs)
and think of any given permutation (example, k=5: E C F B H) as a set of (n-k)! "elementary permutations" (E C F B H A D G, E C F B H A G D, E C F B H D A G, E C F B H D G A, E C F B H G A D, E C F B H G D A) with the end filed off. Which, of course, gives us the same formula: P(n, k) = n!/(n-k)!.
In permutations and combinations with repeats, we can choose the same item more than once. The formulae are P*(n, k) = n^k (obvious) and C*(n, k) = C(n+k-1, k) - not obvious, I'll just quote Wikipedia:
To calculate Probability of an event, we need to express it in terms of simple events with known probabilities, no two of which can occur simultaneously. (It's even better when one of these events always occurs, in which case these are called elementary events).
The answer to (2) is you compute it.
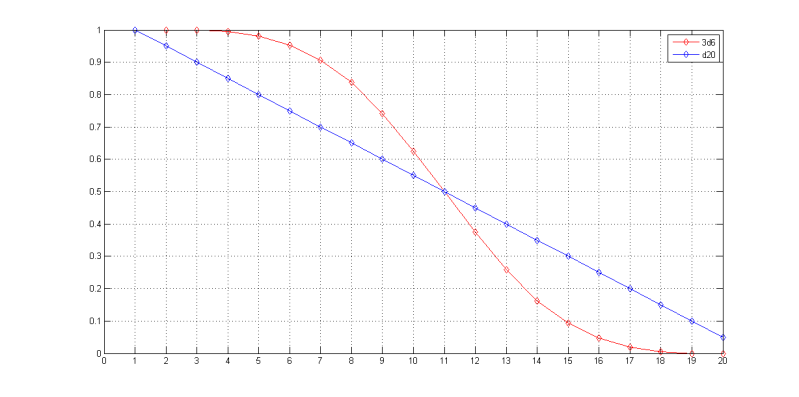
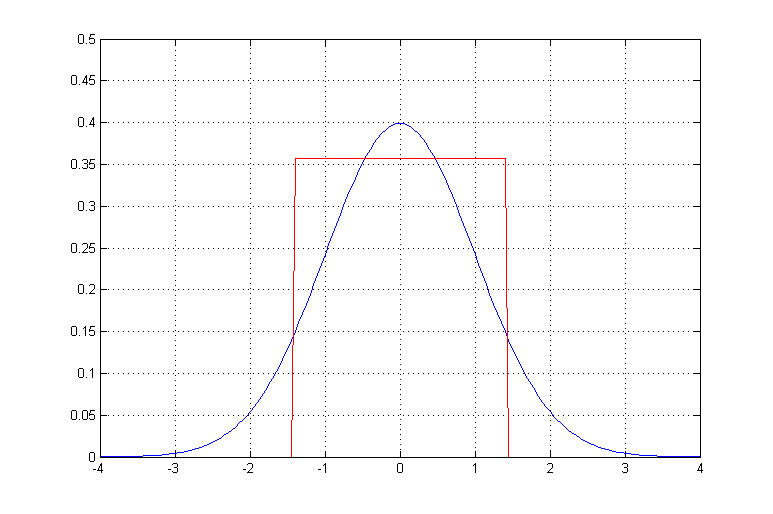
Plotted: probability density, that is the probability of rolling a certain number vs that number.
Note that the solid lines are not part of the actual graph are are drawn for ease of visualization.
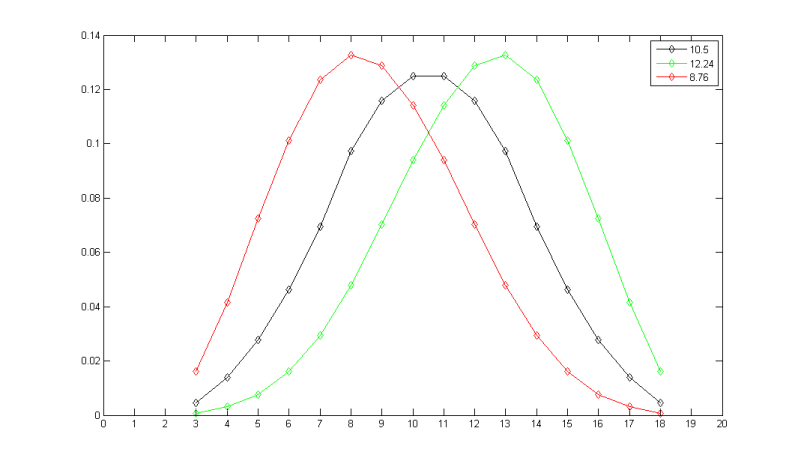
For checks, we need to determine the probability of rolling a certain number or higher. This is calculated by summing up the relevant elementary probabilities (or mirroring and translating the cumulative distribution if you have it computed, which is the probability of rolling a certain number or lower).
Plotted: the probability of rolling a certain number or higher on 3d6 and d20 vs that number. Note that the curves intersect at (11, 0.5).
Using the curves, it is possible to calculate the effect of bonuses and penalties. On a d20, every +1 is a 5% increase. On 3d6, it depends where you are on the curve, which may or may not be a good thing.
"What is off the RNG" is a question of game design. It depends on what and how often you roll and the consequences of success/failure. If any approximation can be made at all, it's "three times more likely to succeed" (because the Central Limit Theorem states that "all sorts of random shit is a normal distribution", which is an exponential function, and e ~= 2.7), which, of course, brings us to the question "Three times more likely to succeed than who and at what?"
Also, from the above it's obvious 3d6 is really short. If we use DC11 (p=0.5) as the baseline, the sliding off begins at +8 +7 on a d20, and even +3 is pushing it on 3d6.
Edit: corrected the fvckup.
Code: Select all
A B C D E F G H            . . . . . . . .
                       to                             -- example
. . . . . . . .            E C F B H A D G
In permutations and combinations with repeats, we can choose the same item more than once. The formulae are P*(n, k) = n^k (obvious) and C*(n, k) = C(n+k-1, k) - not obvious, I'll just quote Wikipedia:
There is an easy way to understand the above result. Imagine we have n + k identical boxes arranged on a line. From these boxes (except the first one), we arbitrarily choose k of them and mark the chosen boxes as empty. The rest of the boxes can be filled by the n elements in the set S. For each non-empty box, if it is followed by M successive empty boxes, we choose the corresponding element in the non-empty box M times. As a result, each arrangement of choosing empty boxes corresponds to a way of choosing k out of the n elements with repetition. The total number is therefore the number of combinations with repetition.
To calculate Probability of an event, we need to express it in terms of simple events with known probabilities, no two of which can occur simultaneously. (It's even better when one of these events always occurs, in which case these are called elementary events).
The answer to (2) is you compute it.
Plotted: probability density, that is the probability of rolling a certain number vs that number.
Note that the solid lines are not part of the actual graph are are drawn for ease of visualization.
For checks, we need to determine the probability of rolling a certain number or higher. This is calculated by summing up the relevant elementary probabilities (or mirroring and translating the cumulative distribution if you have it computed, which is the probability of rolling a certain number or lower).
Plotted: the probability of rolling a certain number or higher on 3d6 and d20 vs that number. Note that the curves intersect at (11, 0.5).
Using the curves, it is possible to calculate the effect of bonuses and penalties. On a d20, every +1 is a 5% increase. On 3d6, it depends where you are on the curve, which may or may not be a good thing.
"What is off the RNG" is a question of game design. It depends on what and how often you roll and the consequences of success/failure. If any approximation can be made at all, it's "three times more likely to succeed" (because the Central Limit Theorem states that "all sorts of random shit is a normal distribution", which is an exponential function, and e ~= 2.7), which, of course, brings us to the question "Three times more likely to succeed than who and at what?"
Also, from the above it's obvious 3d6 is really short. If we use DC11 (p=0.5) as the baseline, the sliding off begins at +8 +7 on a d20, and even +3 is pushing it on 3d6.
Edit: corrected the fvckup.
Last edited by Starmaker on Fri Apr 03, 2009 4:25 pm, edited 1 time in total.
I don't think I follow. Based on your graph, rolling a 14+ on 3d6 looks considerably more likely than rolling a 19+ on 1d20.Starmaker wrote:Also, from the above it's obvious 3d6 is really short. If we use DC11 (p=0.5) as the baseline, the sliding off begins at +8 on a d20, and even +3 is pushing it on 3d6.

-
Absentminded_Wizard

- Duke
- Posts: 1122
- Joined: Fri Mar 07, 2008 7:54 pm
- Location: Ohio
- Contact:
-
Heath Robinson
- Knight
- Posts: 393
- Joined: Sun Aug 17, 2008 9:26 am
- Location: Blighty
-
Draco_Argentum
- Duke
- Posts: 2434
- Joined: Fri Mar 07, 2008 7:54 pm
Read more carefully. Starmaker said that "sliding off" begins at (11)+8 for a d20 but at or before (11)+3 on 3d6. That implies that DC 19 is more "on the RNG" on a d20 than DC 14 is on 3d6, unless I'm totally failing to understand what he's trying to say.Hicks wrote:I think your monitor is upside-down.
14+ on a d20 is a little less than 40% likely.
14+ on 3d6 is a little less than 20% likely.
Rolling 14+ is certainly more likely on a d20 than on 3d6, but rolling a fourteen or higher on 3d6 is still more likely than rolling a nineteen or higher on 1d20. I agree that the 3d6 curve is sharper, I just want to know where he's getting those specific thresholds from.
-
TarkisFlux
- Duke
- Posts: 1147
- Joined: Sun Jun 22, 2008 9:44 pm
- Location: Magic Mountain, CA
- Contact:
Fuck. I take a day off and I miss all the good math stuff. Sad now.
Off the RNG isn't really about where the DC is and how likely it is to be beaten; those things are important but vary wildly based on what you want to see in your game, how common bonuses are, and what characters of a certain power level should be able to reliably succeed at. In that sense, the DCs that Star's talking about make a lot of sense, because they're just looking at how big a modifier it takes to make a standard DC extremely likely to succeed (about 3 times more likely than without bonuses if I'm reading right).
Off the RNG (at least when I see it tossed around here) is much more about how characters with different modifiers are an entire random number generator (all possible die rolls) apart on bonuses alone (so > +20 difference in modifier alone on a d20). There are situations where you're probably fine with characters auto succeeding at a task, especially in a level game where you just don't care about low level tasks after some point. But you probably don't want some characters in the same power band beating one another by more than the max die roll if they're supposed to be playing the same game or competing in the same sub-system.
The wiki you should be linking to when you need a wiki link - http://www.dnd-wiki.org
Fectin: "Ant, what is best in life?"
Ant: "Ethically, a task well-completed for the good of the colony. Experientially, endorphins."
Fectin: "Ant, what is best in life?"
Ant: "Ethically, a task well-completed for the good of the colony. Experientially, endorphins."
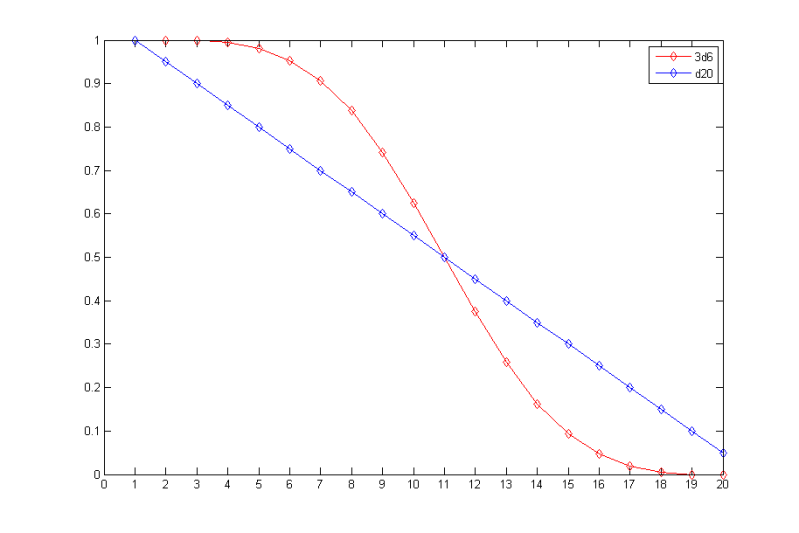
The same graph with the grid added:
 Also, the thresholds are now corrected, and yes, I fvcked up, that would be +7 for d20.
The idea is that a probability becomes noticeably lower if it's e (~=3) times less than usual (I'm going to use "zomg English is not my first language and it was 5am" as a defense). When physicists want to generate a random variable that's on a bell curve but modelling an actual bell curve takes too much time, they can resort to uniform distribution on [x1; x2] where f(x1,2)=f(M)/e.
 Assuming "usual" as 0.5 for a mundane task, sliding off begins when a probability is lower than 0.5/3 = 0.167, thus 3d6 slides off at 8 (0.162 to fail) and 14 (0.162 to succeed) and d20 at 4 (0.15 to fail) and 18 (0.15 to succeed).
The idea is that a probability becomes noticeably lower if it's e (~=3) times less than usual (I'm going to use "zomg English is not my first language and it was 5am" as a defense). When physicists want to generate a random variable that's on a bell curve but modelling an actual bell curve takes too much time, they can resort to uniform distribution on [x1; x2] where f(x1,2)=f(M)/e.
Shadowrun statistics dump
20th Anniversary Shadowrun 4
MatLab R2008a
Basic probabilities: straightforward Bernoulli distribution
Explosions: iterative method
1 to 20 dice
0 to 10 successes
(1) Isometric overview:
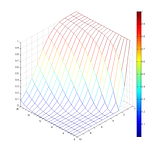 Z: probability to roll Y+ successes on X dice, no explosions.
(2) Non-cumulative probabilities:
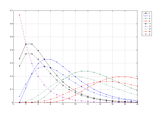 Y: probability to roll EXACTLY <sidebar> successes on X dice.
Solid lines: no explosions.
Dashed lines: with explosions.
These are NOT probability curves (probability curves are plotted vs. outcomes), have next to none actual in-game meaning and are only provided for comparison.
(3) Cumulatuve probabilities:
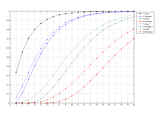 Y: probability to roll <sidebar> or more successes on X dice.
Solid lines: no explosions.
Dashed lines: with explosions.
These are also NOT probability curves but do have an in-game meaning due to being cumulative.
(4) Probability density curves:
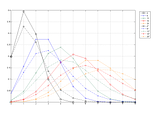 Y: probability to roll EXACTLY X successes on <sidebar> dice.
Solid lines: no explosions.
Dashed lines: with explosions.
The area below each curve is equal to 1, as it should be.
(5) Cumulative probability distribution curves, mirrored and translated:
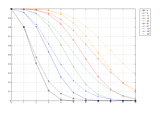 Y: probability to roll X or more successes on <sidebar> dice.
Solid lines: no explosions.
Dashed lines: explosions.
Code:
Also, I'd appreciate if someone posted typical roll/keep pools and explosion rules for L5R.
MatLab R2008a
Basic probabilities: straightforward Bernoulli distribution
Explosions: iterative method
1 to 20 dice
0 to 10 successes
(1) Isometric overview:

(2) Non-cumulative probabilities:

Solid lines: no explosions.
Dashed lines: with explosions.
These are NOT probability curves (probability curves are plotted vs. outcomes), have next to none actual in-game meaning and are only provided for comparison.
(3) Cumulatuve probabilities:

Solid lines: no explosions.
Dashed lines: with explosions.
These are also NOT probability curves but do have an in-game meaning due to being cumulative.
(4) Probability density curves:

Solid lines: no explosions.
Dashed lines: with explosions.
The area below each curve is equal to 1, as it should be.
(5) Cumulative probability distribution curves, mirrored and translated:

Solid lines: no explosions.
Dashed lines: explosions.
- Edge, besides allowing explosions, adds to the dice pool. This is not accounted for directly because the graphs are cluttered enough without a 4th dimension. For example, on (5), the chance to succeed on (8, 4) is ~0.25 (solid blue) and ~0.7 with Edge 4 (dashed green).
- Colors and markers do not correlate between (2),(3) and (4),(5).
- 4x dice buy x hits (buying auto hits, p. 62). Remarkably, this happens when the probability to roll the number of hits in question exceeds 0.8. Thus, one can say the "Off the RNG" criterium is "20-% chance of failure seriously doesn't count". (Of course, it counts when failure matters, but so does the 1/6 from earlier posts).
- Glitches can be calculated in two ways: with and without differentiating between a glitchtastic failure and a glitch-flavored success. Neither is implemented.
Code: Select all
Density w/o explosions

    0.6667    0.4444    0.2963    0.1975    0.1317    0.0878    0.0585    0.0390    0.0260    0.0173    0.0116    0.0077    0.0051    0.0034    0.0023    0.0015    0.0010    0.0007    0.0005    0.0003
    0.3333    0.4444    0.4444    0.3951    0.3292    0.2634    0.2048    0.1561    0.1171    0.0867    0.0636    0.0462    0.0334    0.0240    0.0171    0.0122    0.0086    0.0061    0.0043    0.0030
         0    0.1111    0.2222    0.2963    0.3292    0.3292    0.3073    0.2731    0.2341    0.1951    0.1590    0.1272    0.1002    0.0779    0.0599    0.0457    0.0345    0.0259    0.0193    0.0143
         0         0    0.0370    0.0988    0.1646    0.2195    0.2561    0.2731    0.2731    0.2601    0.2384    0.2120    0.1837    0.1559    0.1299    0.1066    0.0863    0.0690    0.0546    0.0429
         0         0         0    0.0123    0.0412    0.0823    0.1280    0.1707    0.2048    0.2276    0.2384    0.2384    0.2296    0.2143    0.1948    0.1732    0.1510    0.1294    0.1093    0.0911
         0         0         0         0    0.0041    0.0165    0.0384    0.0683    0.1024    0.1366    0.1669    0.1908    0.2067    0.2143    0.2143    0.2078    0.1963    0.1812    0.1639    0.1457
         0         0         0         0         0    0.0014    0.0064    0.0171    0.0341    0.0569    0.0835    0.1113    0.1378    0.1607    0.1786    0.1905    0.1963    0.1963    0.1912    0.1821
         0         0         0         0         0         0    0.0005    0.0024    0.0073    0.0163    0.0298    0.0477    0.0689    0.0918    0.1148    0.1361    0.1542    0.1682    0.1776    0.1821
         0         0         0         0         0         0         0    0.0002    0.0009    0.0030    0.0075    0.0149    0.0258    0.0402    0.0574    0.0765    0.0964    0.1157    0.1332    0.1480
         0         0         0         0         0         0         0         0    0.0001    0.0003    0.0012    0.0033    0.0072    0.0134    0.0223    0.0340    0.0482    0.0643    0.0814    0.0987
         0         0         0         0         0         0         0         0         0    0.0000    0.0001    0.0005    0.0014    0.0033    0.0067    0.0119    0.0193    0.0289    0.0407    0.0543


Density w/explosions

    0.6667    0.4444    0.2963    0.1975    0.1317    0.0878    0.0585    0.0390    0.0260    0.0173    0.0116    0.0077    0.0051    0.0034    0.0023    0.0015    0.0010    0.0007    0.0005    0.0003
    0.2778    0.3704    0.3704    0.3292    0.2743    0.2195    0.1707    0.1301    0.0975    0.0723    0.0530    0.0385    0.0278    0.0200    0.0143    0.0101    0.0072    0.0051    0.0036    0.0025
    0.0463    0.1389    0.2160    0.2606    0.2743    0.2652    0.2418    0.2113    0.1788    0.1475    0.1192    0.0947    0.0742    0.0574    0.0440    0.0334    0.0252    0.0188    0.0140    0.0103
    0.0077    0.0360    0.0832    0.1349    0.1791    0.2093    0.2241    0.2249    0.2150    0.1977    0.1763    0.1532    0.1303    0.1088    0.0894    0.0725    0.0581    0.0461    0.0362    0.0282
    0.0013    0.0081    0.0253    0.0532    0.0878    0.1233    0.1544    0.1778    0.1918    0.1967    0.1934    0.1839    0.1698    0.1531    0.1351    0.1170    0.0998    0.0839    0.0696    0.0572
    0.0002    0.0017    0.0067    0.0176    0.0352    0.0586    0.0854    0.1123    0.1364    0.1557    0.1688    0.1754    0.1759    0.1711    0.1621    0.1501    0.1362    0.1214    0.1065    0.0922
    0.0000    0.0003    0.0016    0.0051    0.0122    0.0238    0.0399    0.0595    0.0811    0.1028    0.1226    0.1391    0.1513    0.1587    0.1613    0.1596    0.1541    0.1457    0.1351    0.1232
    0.0000    0.0001    0.0004    0.0014    0.0038    0.0085    0.0163    0.0274    0.0417    0.0585    0.0765    0.0947    0.1115    0.1260    0.1373    0.1450    0.1490    0.1493    0.1463    0.1406
    0.0000    0.0000    0.0001    0.0003    0.0011    0.0028    0.0060    0.0113    0.0191    0.0294    0.0421    0.0566    0.0721    0.0876    0.1023    0.1153    0.1259    0.1336    0.1383    0.1400
    0.0000    0.0000    0.0000    0.0001    0.0003    0.0008    0.0020    0.0042    0.0079    0.0133    0.0208    0.0303    0.0417    0.0544    0.0679    0.0816    0.0946    0.1063    0.1162    0.1238
    0.0000    0.0000    0.0000    0.0000    0.0001    0.0002    0.0006    0.0015    0.0030    0.0055    0.0094    0.0148    0.0218    0.0306    0.0408    0.0521    0.0641    0.0762    0.0879    0.0986


Cumulative w/o explosions

    1.0000    1.0000    1.0000    1.0000    1.0000    1.0000    1.0000    1.0000    1.0000    1.0000    1.0000    1.0000    1.0000    1.0000    1.0000    1.0000    1.0000    1.0000    1.0000    1.0000
    0.3333    0.5556    0.7037    0.8025    0.8683    0.9122    0.9415    0.9610    0.9740    0.9827    0.9884    0.9923    0.9949    0.9966    0.9977    0.9985    0.9990    0.9993    0.9995    0.9997
    0.0000    0.1111    0.2593    0.4074    0.5391    0.6488    0.7366    0.8049    0.8569    0.8960    0.9249    0.9460    0.9615    0.9726    0.9806    0.9863    0.9904    0.9932    0.9953    0.9967
    0.0000    0.0000    0.0370    0.1111    0.2099    0.3196    0.4294    0.5318    0.6228    0.7009    0.7659    0.8189    0.8613    0.8947    0.9206    0.9406    0.9558    0.9674    0.9760    0.9824
    0.0000    0.0000    0.0000    0.0123    0.0453    0.1001    0.1733    0.2586    0.3497    0.4407    0.5274    0.6069    0.6776    0.7388    0.7908    0.8341    0.8696    0.8983    0.9213    0.9396
    0.0000    0.0000    0.0000    0.0000    0.0041    0.0178    0.0453    0.0879    0.1448    0.2131    0.2890    0.3685    0.4480    0.5245    0.5959    0.6609    0.7186    0.7689    0.8121    0.8485
    0.0000    0.0000    0.0000    0.0000    0.0000    0.0014    0.0069    0.0197    0.0424    0.0766    0.1221    0.1777    0.2413    0.3102    0.3816    0.4531    0.5223    0.5878    0.6481    0.7028
    0.0000    0.0000    0.0000    0.0000    0.0000    0.0000    0.0005    0.0026    0.0083    0.0197    0.0386    0.0664    0.1035    0.1495    0.2030    0.2626    0.3261    0.3915    0.4569    0.5207
    0.0000    0.0000    0.0000    0.0000    0.0000    0.0000    0.0000    0.0002    0.0010    0.0034    0.0088    0.0188    0.0347    0.0576    0.0882    0.1265    0.1719    0.2233    0.2793    0.3385
    0.0000    0.0000    0.0000    0.0000    0.0000    0.0000    0.0000    0.0000    0.0001    0.0004    0.0014    0.0039    0.0088    0.0174    0.0308    0.0500    0.0755    0.1076    0.1462    0.1905
    0.0000    0.0000    0.0000    0.0000    0.0000    0.0000    0.0000    0.0000    0.0000    0.0000    0.0001    0.0005    0.0016    0.0040    0.0085    0.0159    0.0273    0.0433    0.0648    0.0919


Cumulative w/explosions

    1.0000    1.0000    1.0000    1.0000    1.0000    1.0000    1.0000    1.0000    1.0000    1.0000    1.0000    1.0000    1.0000    1.0000    1.0000    1.0000    1.0000    1.0000    1.0000    1.0000
    0.3333    0.5556    0.7037    0.8025    0.8683    0.9122    0.9415    0.9610    0.9740    0.9827    0.9884    0.9923    0.9949    0.9966    0.9977    0.9985    0.9990    0.9993    0.9995    0.9997
    0.0556    0.1852    0.3333    0.4733    0.5940    0.6927    0.7708    0.8309    0.8764    0.9104    0.9355    0.9538    0.9670    0.9766    0.9834    0.9883    0.9918    0.9942    0.9960    0.9972
    0.0093    0.0463    0.1173    0.2126    0.3196    0.4275    0.5289    0.6196    0.6976    0.7629    0.8162    0.8590    0.8928    0.9191    0.9394    0.9549    0.9666    0.9754    0.9820    0.9869
    0.0015    0.0103    0.0341    0.0777    0.1405    0.2182    0.3049    0.3947    0.4826    0.5652    0.6400    0.7059    0.7625    0.8104    0.8500    0.8824    0.9085    0.9294    0.9458    0.9587
    0.0003    0.0021    0.0088    0.0245    0.0527    0.0949    0.1505    0.2169    0.2908    0.3685    0.4465    0.5220    0.5927    0.6573    0.7149    0.7653    0.8087    0.8455    0.8762    0.9015
    0.0000    0.0004    0.0021    0.0070    0.0175    0.0363    0.0651    0.1046    0.1544    0.2128    0.2777    0.3466    0.4168    0.4862    0.5529    0.6153    0.6725    0.7241    0.7696    0.8094
    0.0000    0.0001    0.0005    0.0018    0.0053    0.0125    0.0252    0.0451    0.0732    0.1100    0.1551    0.2075    0.2655    0.3275    0.3915    0.4557    0.5184    0.5784    0.6345    0.6862
    0.0000    0.0000    0.0001    0.0005    0.0015    0.0040    0.0089    0.0177    0.0315    0.0516    0.0786    0.1128    0.1540    0.2015    0.2542    0.3107    0.3695    0.4291    0.4882    0.5456
    0.0000    0.0000    0.0000    0.0001    0.0004    0.0012    0.0029    0.0064    0.0125    0.0222    0.0365    0.0562    0.0819    0.1139    0.1519    0.1954    0.2436    0.2955    0.3499    0.4056
    0.0000    0.0000    0.0000    0.0000    0.0001    0.0003    0.0009    0.0022    0.0046    0.0088    0.0156    0.0259    0.0403    0.0595    0.0839    0.1138    0.1491    0.1892    0.2337    0.2817
Code: Select all
Scoreboard = zeros(11, 20);
ThisIsYourAnswer = zeros(11, 20);
IterativeSB = zeros(11, 20);
BaseVector = zeros(1, 11);
ZomgExplodingAnswer = zeros(11, 20);

for y=0:1:10
    for x=max(y, 1):1:20
        if x > 2*y
            Scoreboard(y+1, x) = prod(x-y+1:1:x)/prod(1:1:y)*3^(-y)*1.5^(y-x);
        else
            Scoreboard(y+1, x) = prod(y+1:1:x)/prod(1:1:x-y)*3^(-y)*1.5^(y-x);
        end
    end
end

BaseVector(1) = 2/3;
%BaseVector(2) = 1/3;
BaseVector(2:1:11) = 6.^(-1:-1:-10)*5/3;
IterativeSB(:, 1) = BaseVector(:);
for x=2:1:20
    for y=1:1:11
        IterativeSB(y, x) = BaseVector(y:-1:1)*IterativeSB(1:1:y, x-1);
    end
end

ThisIsYourAnswer(1, :) = 1;
ZomgExplodingAnswer(1, :) = 1;
for y=2:1:11
    ThisIsYourAnswer(y, :) = ThisIsYourAnswer(y-1, :)-Scoreboard(y-1, :);
    ZomgExplodingAnswer(y, :) = ZomgExplodingAnswer(y-1, :)-IterativeSB(y-1, :);
end